
In our first part of our introduction to analytics we got you started on your analytics journey and hopefully you now have the code on all your website pages which will help you track your visitors’ online activity.
This week we will talk through with you how to view your analytics and get a real idea of what is making people ‘click’.
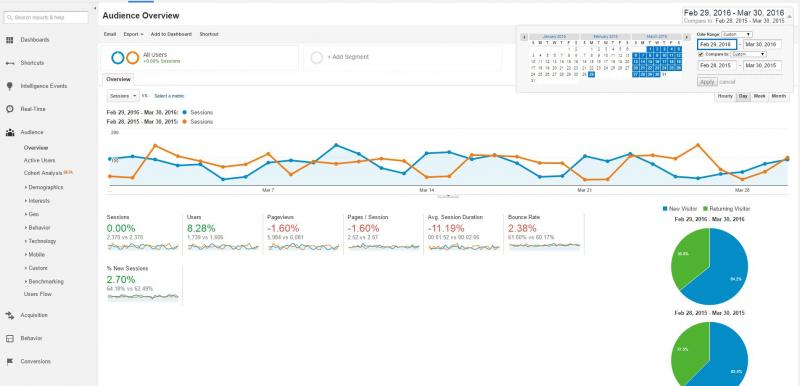
It is a good idea to get familiar with all of the aspects of your analytics dashboard once you have signed up to Google analytics, and get to see what it can actually show you and where. There are many different functions that you can access, including customer demographics and customer journey so it is worth having a good look round your dashboard to familiarise yourself with everything. When you open up your analytics account you can see a general overview of your website audience – where they live, whether they are new or returning and how many sessions you’ve had on your website.

You can delve a bit deeper into your audience by clicking on each of the buttons on the left hand side. You can look at their;
- Demographics
- Interests
- Geo
- Behaviour
- Technology
- Mobile
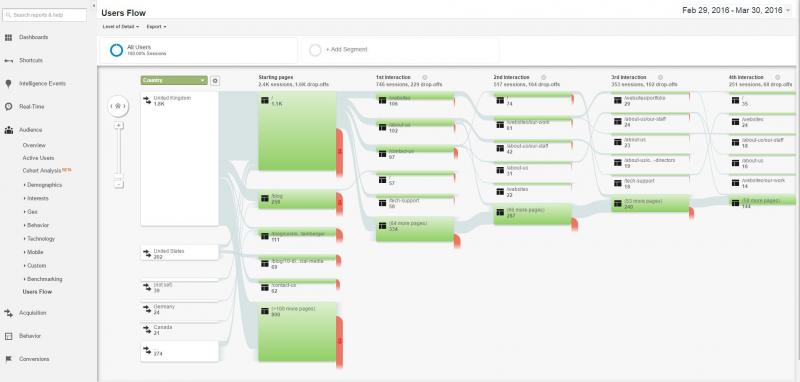
- And more, including custom searches and also the ‘flow’ – which is customer journey through your site.
By looking at all of these details of your visitor, you can get a true understanding of those people who are visiting your site. It is important to realise who they are so that you can target them in the right way, and tailor your content to suit your demographic. You might be surprised at what you find, so go in with an open mind!
You can also compare any of your analytics to a previous period of time, for example you may want to look at how your visitors compare with those at the same time last year. What are you doing differently (if anything) and have your views gone up or down. It is so important to be reviewing your activity at regular intervals and this will really help you understand that.
So what can our audience insights show us?
- How many people have visited in a given timeframe?
- How popular is your site – are visits increasing or decreasing?
- New visits vs return visits – are they loyal or new?
- Where do they come from – is it where you expected?
- What is their age, gender, interests – any surprises?
An important factor to consider within all of this is your bounce rate. You may be getting a lot of visitors, but how long are they staying? Your bounce rate will tell you this – the higher the rate, the less time they are staying on your site. A bounce is a single interaction with a page on your website, and then leaving. There are a number of bounce rate scenarios;
- The visitor clicks the back button (this is the most common)
- The visitor closes the browser (window or tab)
- The visitor types a new URL
- The visitor does nothing – and the session times out after 30 minutes

Either way, what this shows us is that either your website isn’t of good quality, or it isn’t what they were looking for. This is where your SEO is important to consider. They may have found you through a search on google, where you have appeared but after clicking on your website it isn’t what they were looking for after all. So is it the quality of your site, or the quality of your optimisation that isn’t working for you?
You can look at the behaviour of your visitor – how long did they stay on the site, how many pages did they visit, and which pages? Also, does the time they spent on your site correlate with the number of pages they visited? And if not – does this mean the quality of the pages isn’t up to scratch? You can see if your visitor jumped from page to page staying just a few seconds on each one, and if this is the case then your website content isn’t relevant or compelling enough for them. Think about how you can address this.
It is also important to understand what device your audience is viewing your site on, and whether your website works on all platforms. Are they staying longer or not whilst viewing on a mobile device? And if the bounce rate is higher via a mobile does this mean your site isn’t optimised well enough? Again, by understanding all of these analytics you can focus on keeping your visitors on your site and converting them into customers.
Take a look at the behaviour of your site. By looking at the overview you can see the pages that people have stayed on the most, but interestingly by looking at your behaviour ‘flow’ you can monitor the journey of your visitor. Which page did they land on and where did they go after that? How many interactions did they make on the site? What was the bounce rate of each page – and which pages did people stay the longest on?
There is so much to cover about Google analytics that it is hard to contain it all to a few blog posts, but that is why it is so important to get to grips with it all in your own time.
Next time we will talk about referrals from other sites, and also look at your social media activity and how that affects your website hits.